Yu-portfolio
Final Project - COFFEE AND HEALTH
Final Project Part Ⅲ
Final Project Index
Final Part Ⅰ
Final Part Ⅱ
Final Part Ⅲ
Shorthand Page
Back to Portfolio
Brief of the Final Project 📝
PartⅠ
In this section, I determined the theme of my story and conducted extensive data and literature research. At this point, I had conceived the story’s arc, created six scenarios, and determined the visual sketch for each stage of the story. The feedback from the class taught me how to improve in the next section.
PartⅡ
In the second part of the project, I used tools like Tableau, Flourish, and Infogram to convert the sketches into wireframes and enrich the story structure of each section to create a preliminary and complete storyboard. Furthermore, the most important aspect of this section is user research. I present the designed storyboard to three different audiences, each of which is diverse in terms of age, gender, and occupation. Following user research, I received a lot of useful feedback, which allowed me to improve the story structure and the visualization’s integrity even further. At the same time I also got peer feedback from class.
PartⅢ
In the final step, I will modify the visualization based on user feedback. Simultaneously, when designing the shorthand page, refine the storyboard in accordance with the page’s requirements and theme color. So, in this section, I will primarily change the following:
- Change data visualization based on user feedback.
- Modify the story structure to ensure audience participation.
- Refine the storyboard in accordance with Shorthand’s production requirements.
- Add some text, ask questions or list data at some key transitions or story reversals to attract audiences.
The Audience 📓
Because the final call to action actually instructs the audience on how much coffee is appropriate to consume (the moderate coffee consumption) and to not be overly concerned with caffeine, addicts of coffee are most likely to gain from this. In addition, many coffee drinkers worry excessively about the negative effects of coffee on their bodies, or some people want to try drinking coffee but stop due to excessive concern. All of them will be the audience of this project.
While I was reviewing user research, I discovered that a respondent had stated that her family would discourage her from drinking coffee by telling her that it is bad for her body. My family members also say that quite frequently. In fact, in these situations, the target audience for this project can be categorized as parents of high school or college students. I want to use this project to help them become less overly concerned about coffee and its effects.
In conclusion, the target audience for this project consists of coffee addicts, consumer who drink it regularly but are concerned about its health effects, people who want to drink coffee but worry about the risks, and parents of high school or college students who are concerned about caffeine’s effects.
Final design ✏️
Shorthand Page
Final Design Decisions
The topic is: Take Caffeine Concerns Less Seriously, coffee can be part of a healthy diet.
This project is divided into three sections: setting, conflict and solution.
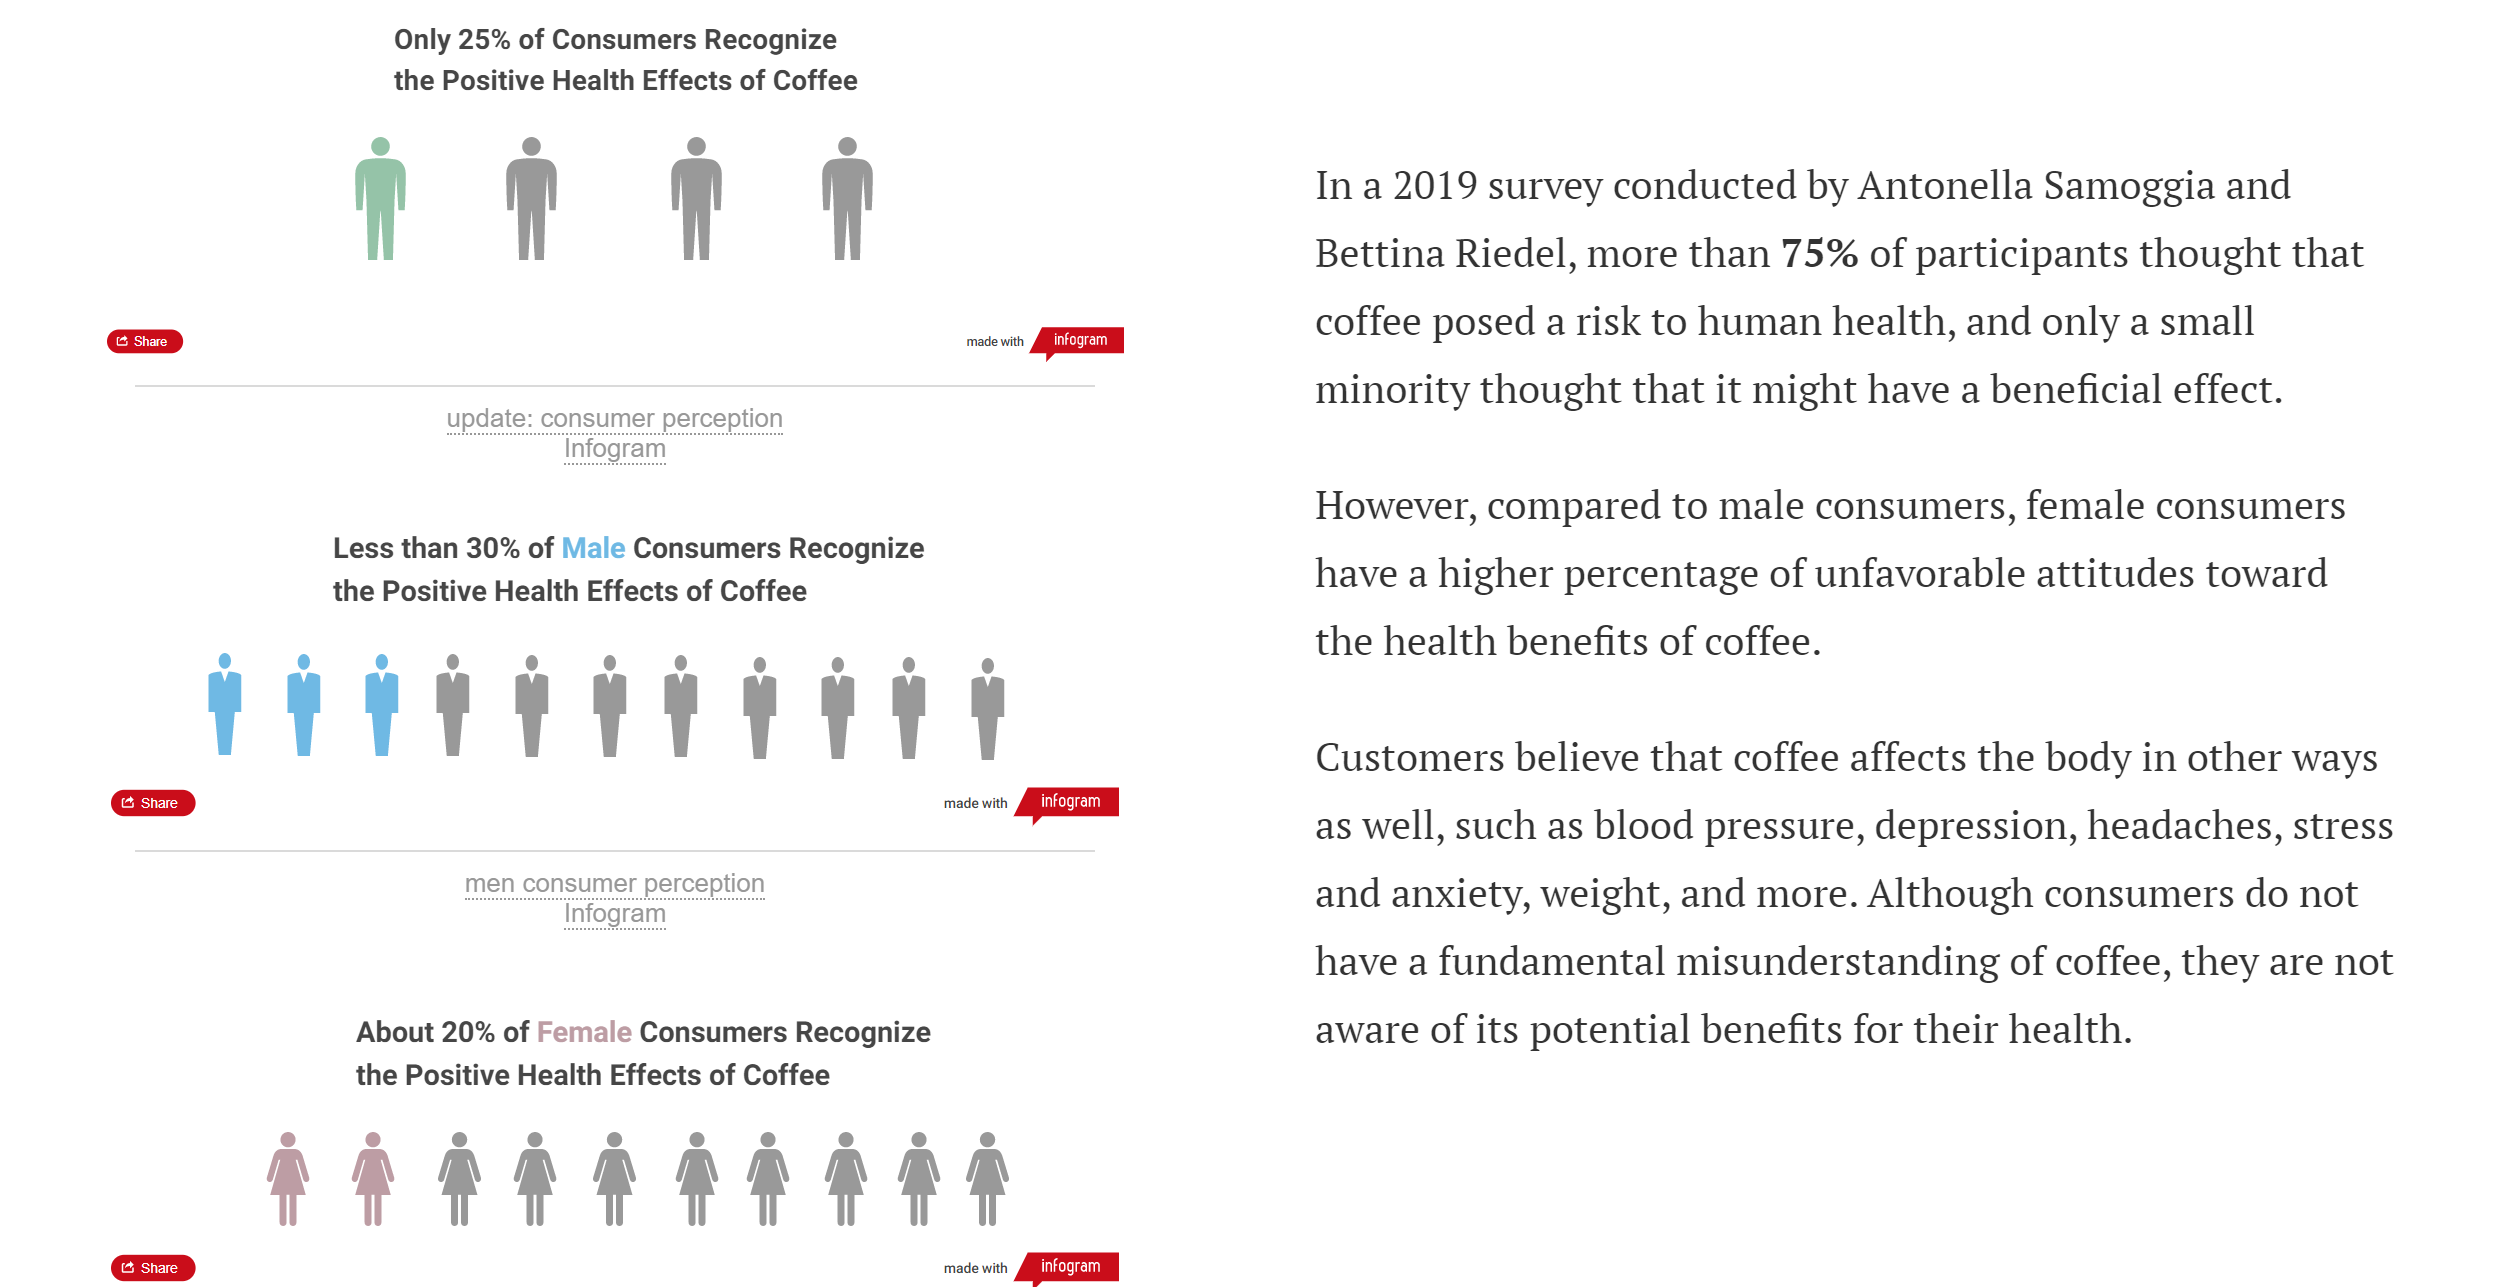
The first section is to establish the prerequisite background, which includes parts 1 and 2. In this section, I’d like to use data to demonstrate how coffee sales and consumption have increased significantly over the last ten years. Then, using survey data, we can see that, while coffee is becoming increasingly popular around the world, and there are more and more coffee consumers, only 25% of respondents believe that coffee is not harmful to our bodies, and this proportion is higher than that of women. 20% is even less.
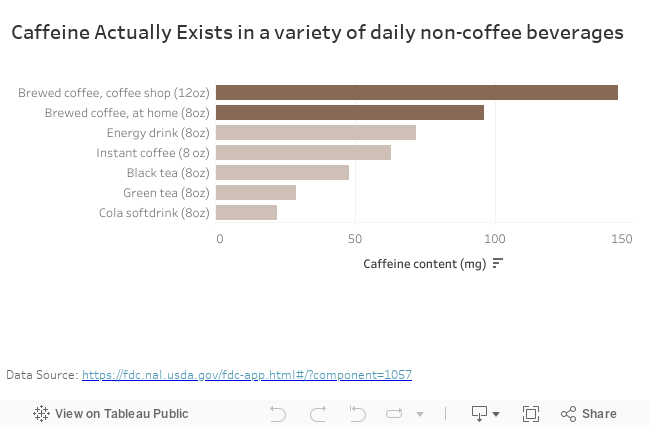
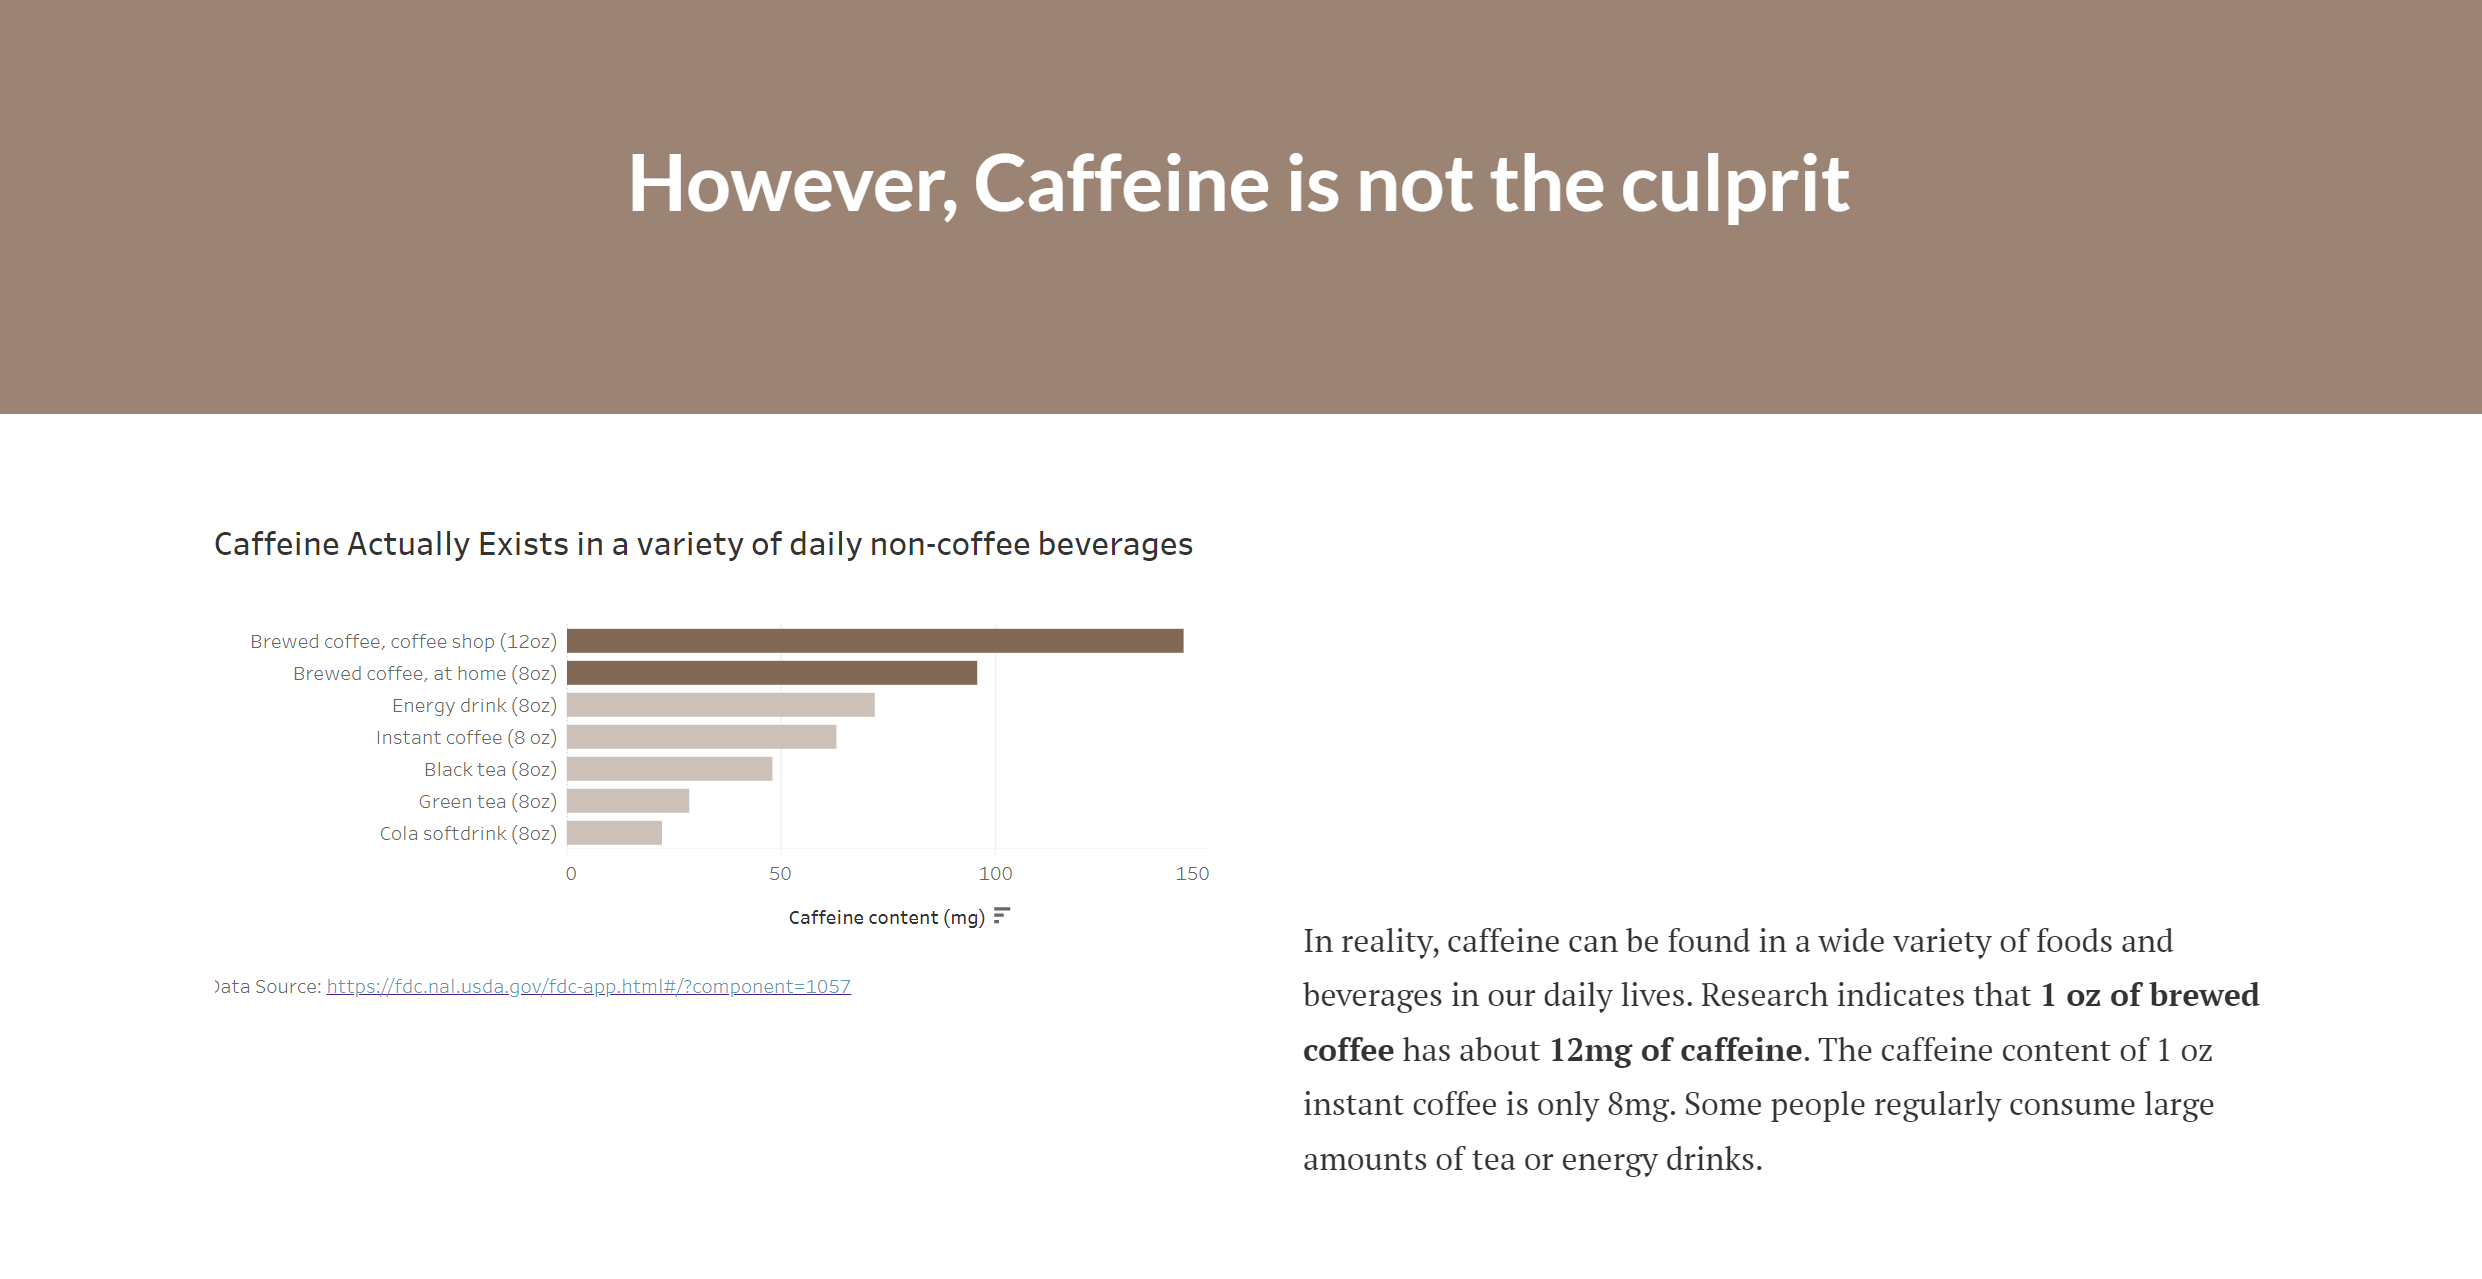
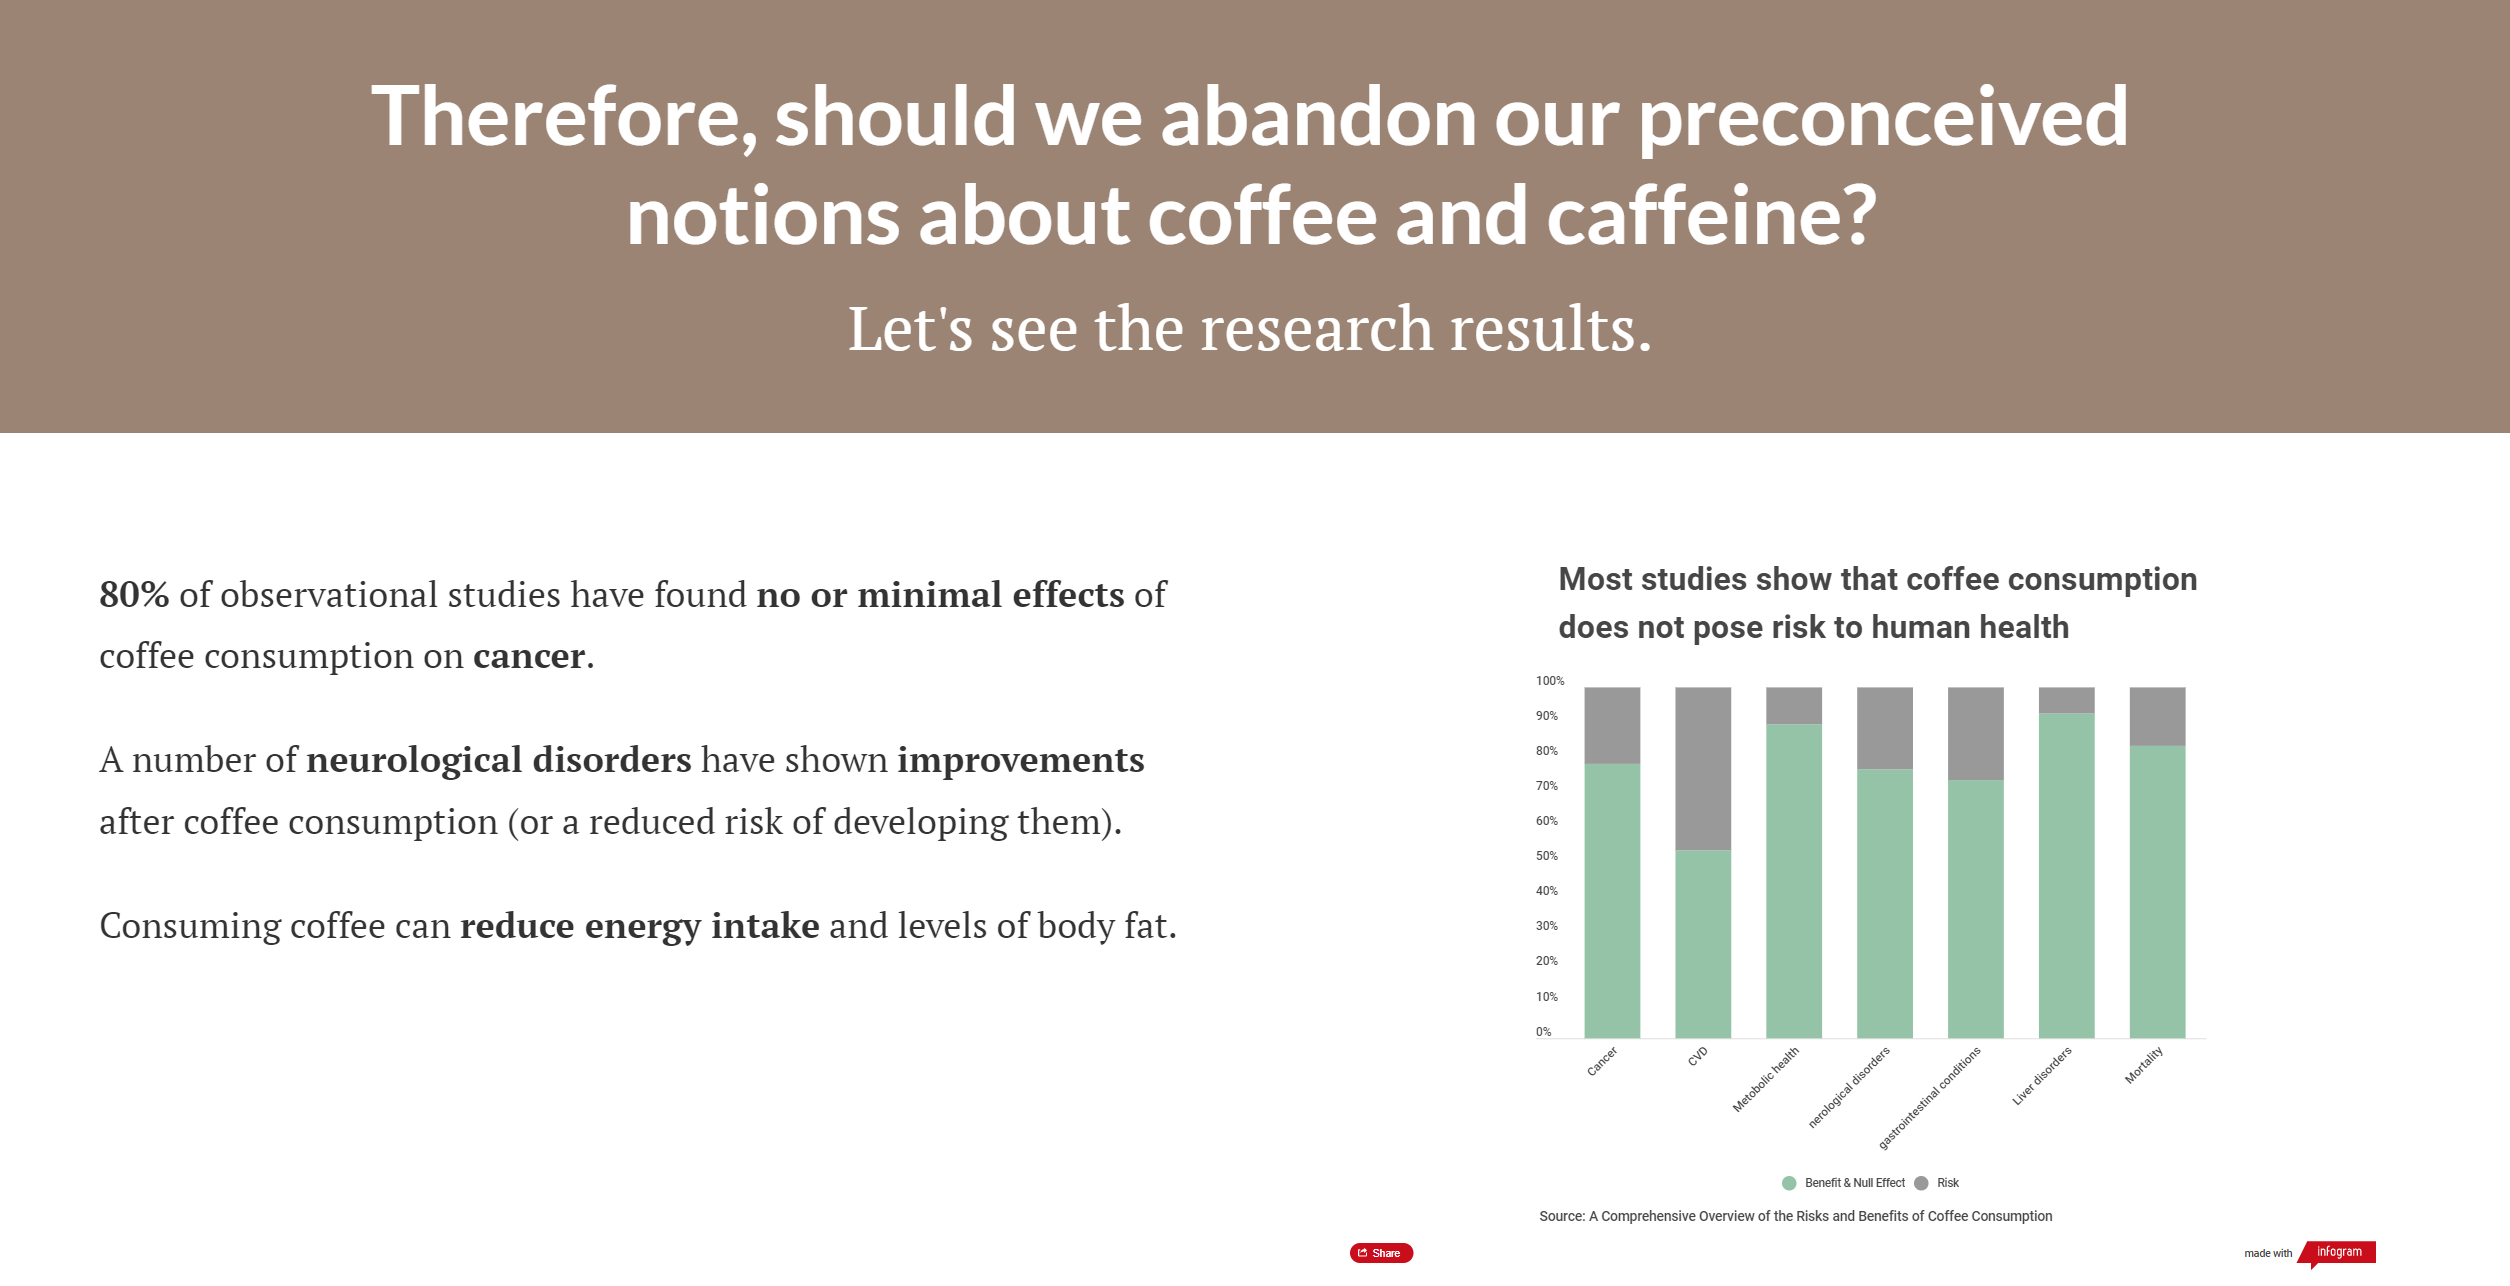
The second section is the contradiction and parts 3, 4, and 5 are included here. In this section, it will be explained that caffeine can be found in many non-coffee beverages in everyday life, and that 1 oz of brewed coffee contains 12mg of caffeine. Caffeine should not be blamed. A research report compiles recent research on the relationship between coffee and diseases, and the findings show that coffee poses no risk to many diseases. In fact, it has no effect and, in some cases, is even beneficial to the body. At the end of this section, I provide data demonstrating that moderate coffee consumption can reduce the likelihood of certain diseases. This sparked the audience’s thinking by creating a gap between the public’s perception of coffee and the actual research findings.
The final section addresses the public’s excessive coffee concerns and questions about moderate coffee consumption. It clearly shows how many cups of coffee and how many mg of caffeine are in moderate coffee consumption through the visual form, reducing the audience’s caffeine concerns.
To match the theme color, the entire shorthand is brown.
Changes made since Part Ⅱ
Title and Introduction
Title Page:
I have changed the title of the final presentation from “Coffee and Health” to “Coffee can be part of a health diet”. I wish I could draw the audience in with a headline that is more direct and explicit.
Introduction Page
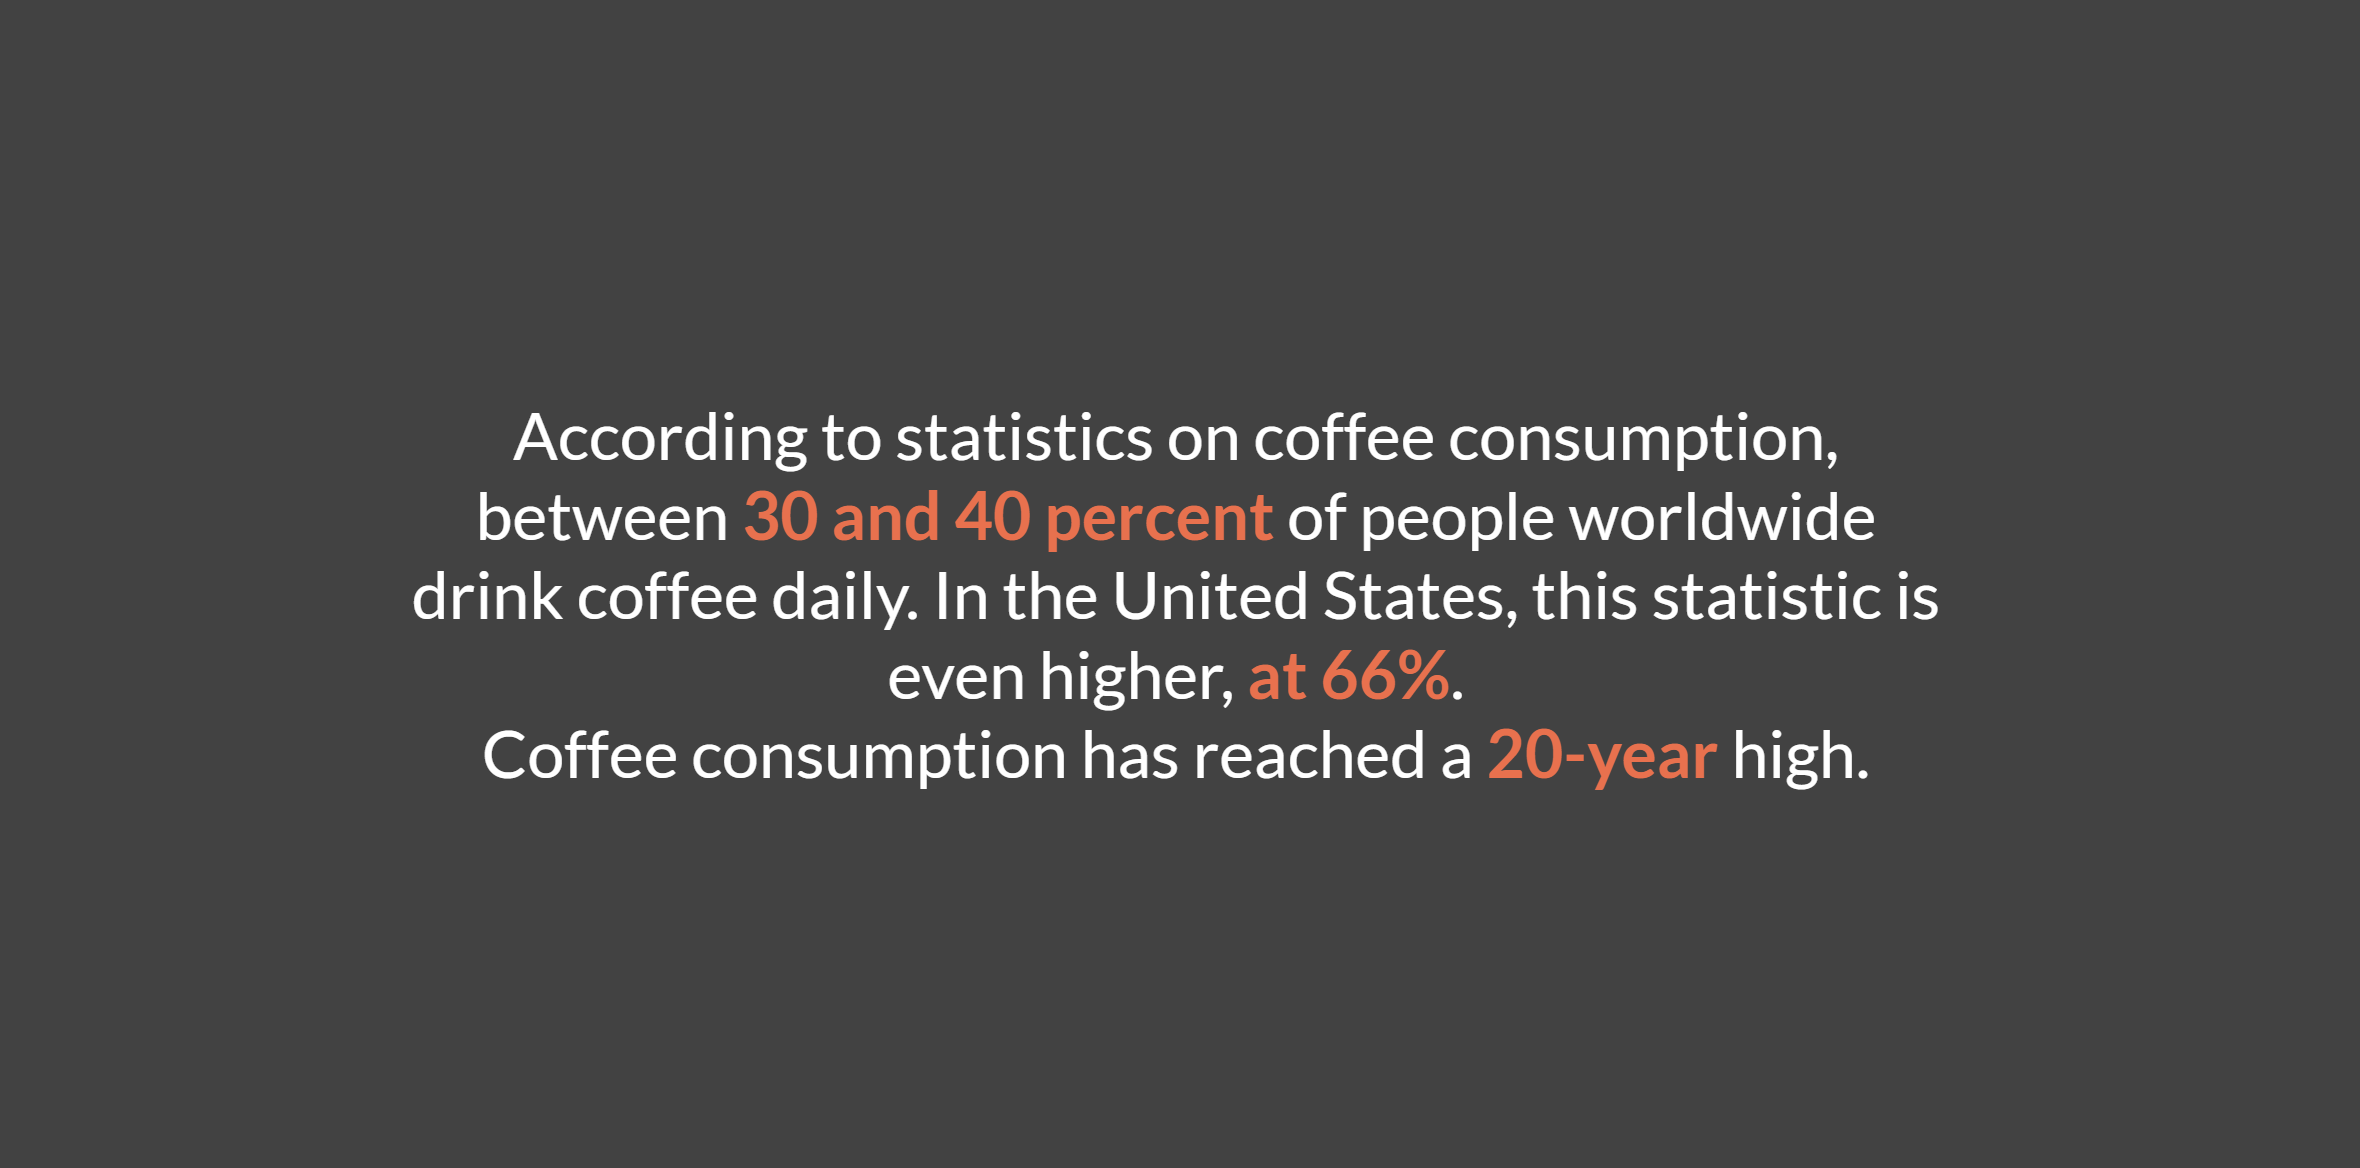
After the title, I added a transition paragraph to lead out the whole story.
Part 1: Analyze coffee consumption trends
Part 1.1
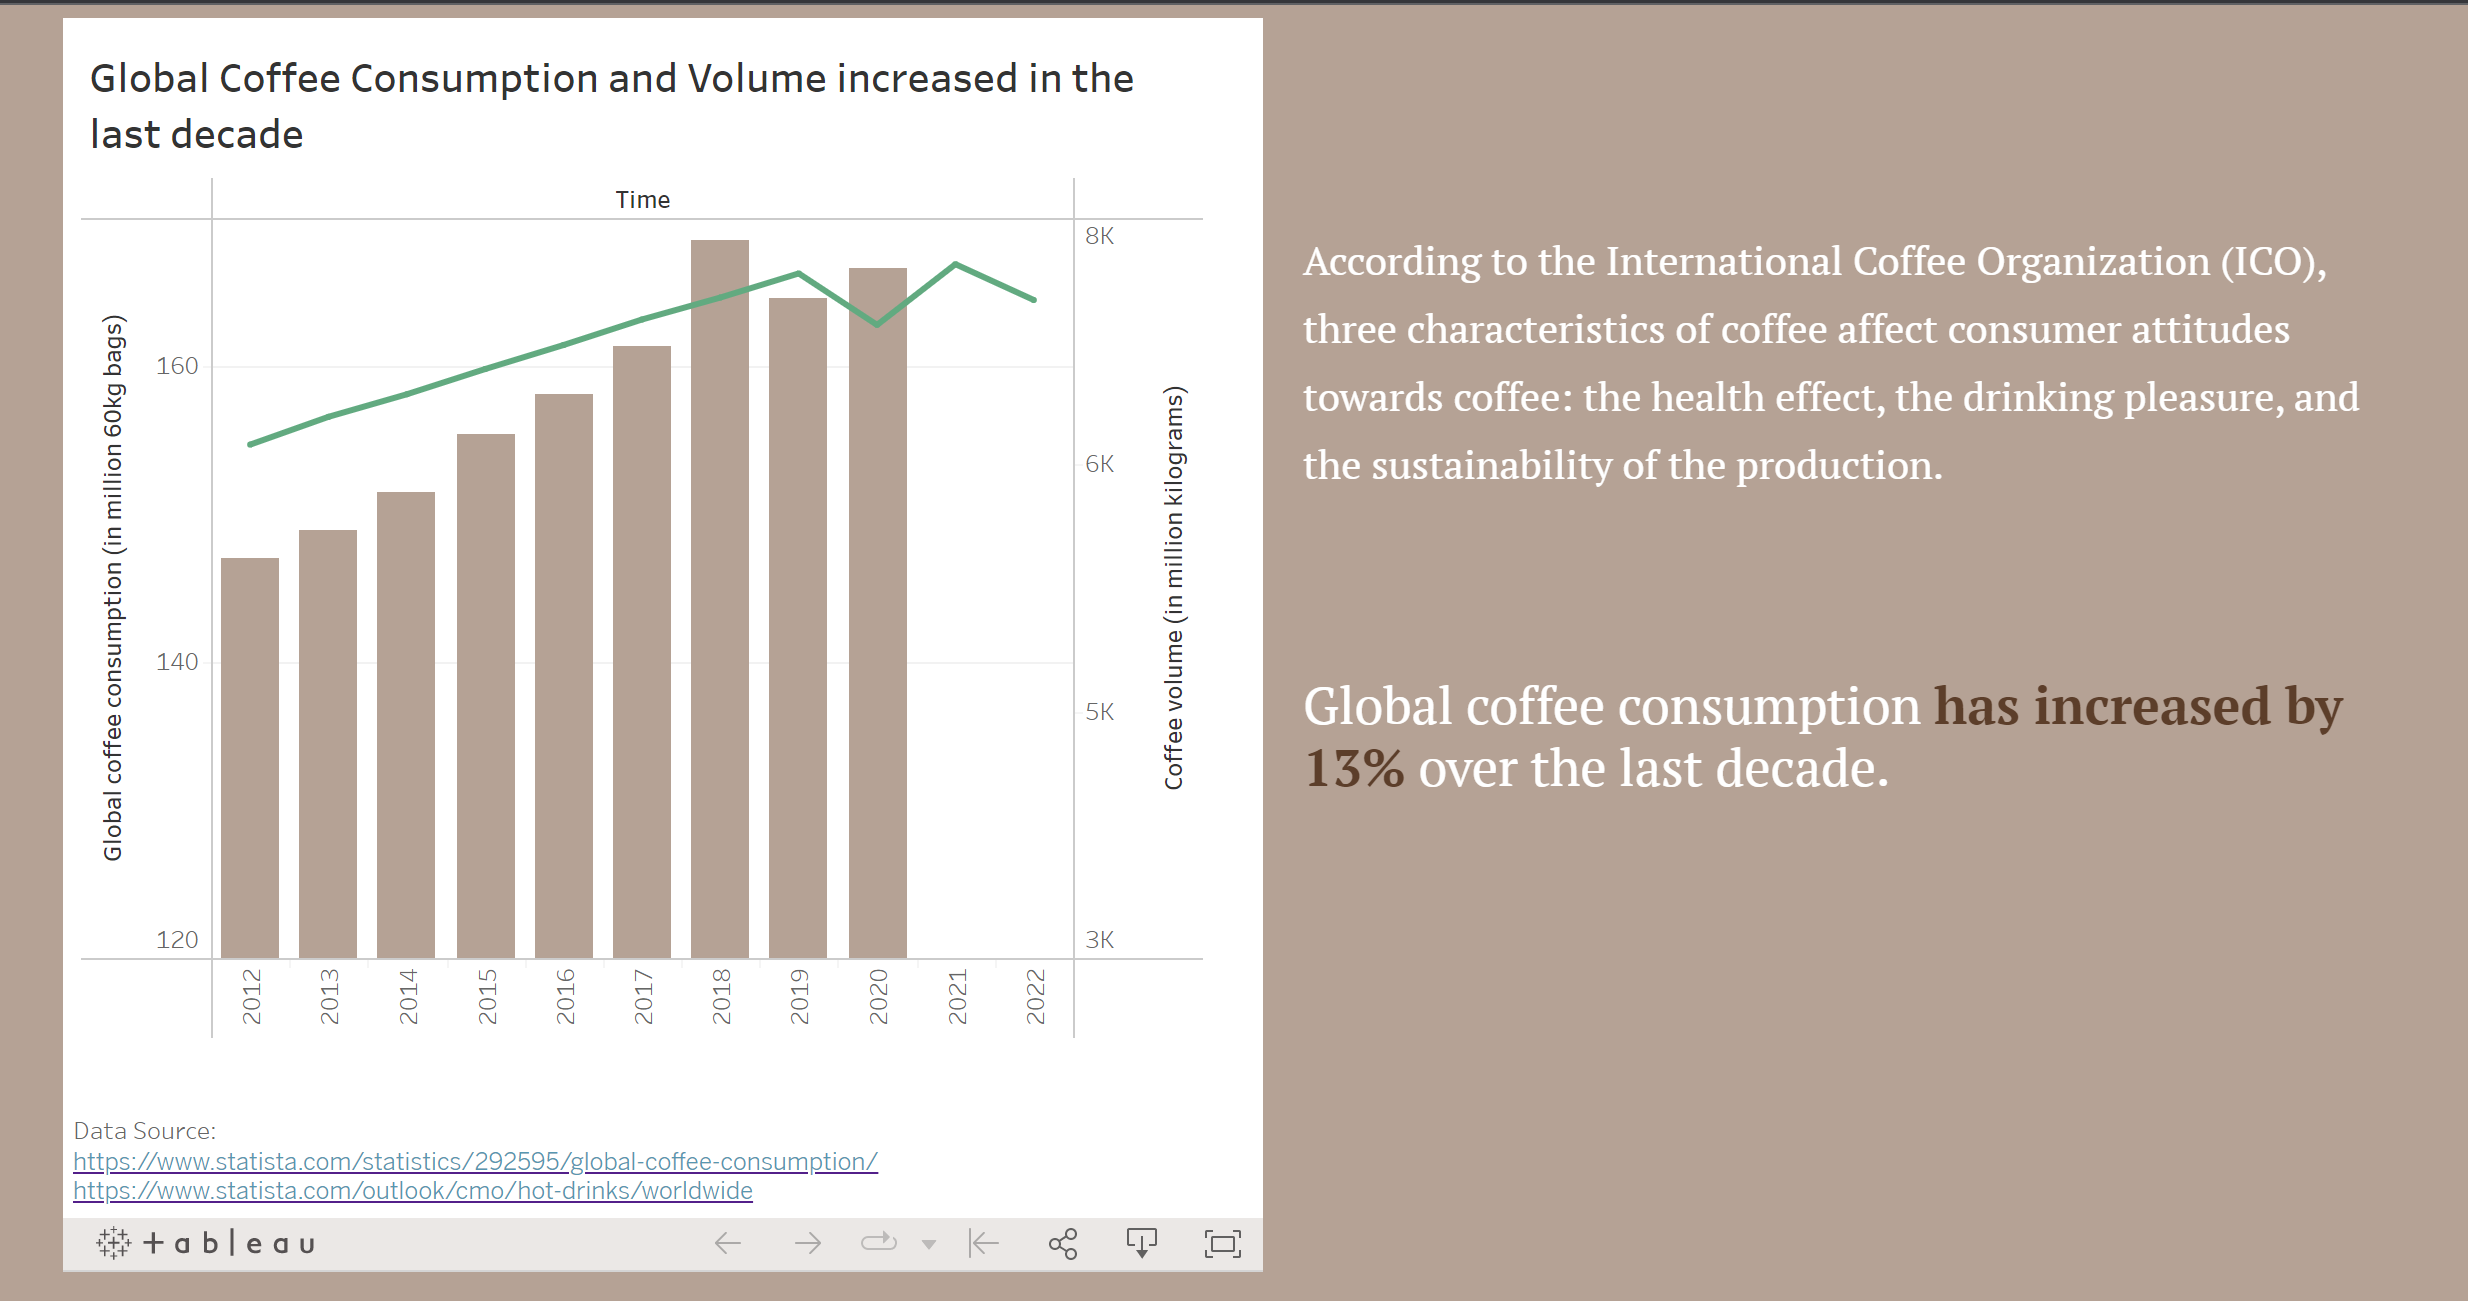
I haven’t changed the visualization of part 1.1, but I have added explanatory text on the right side of the page and highlighted the ten-year growth rate to better illustrate the rise in global coffee consumption and production.
After change:
Part 1.2
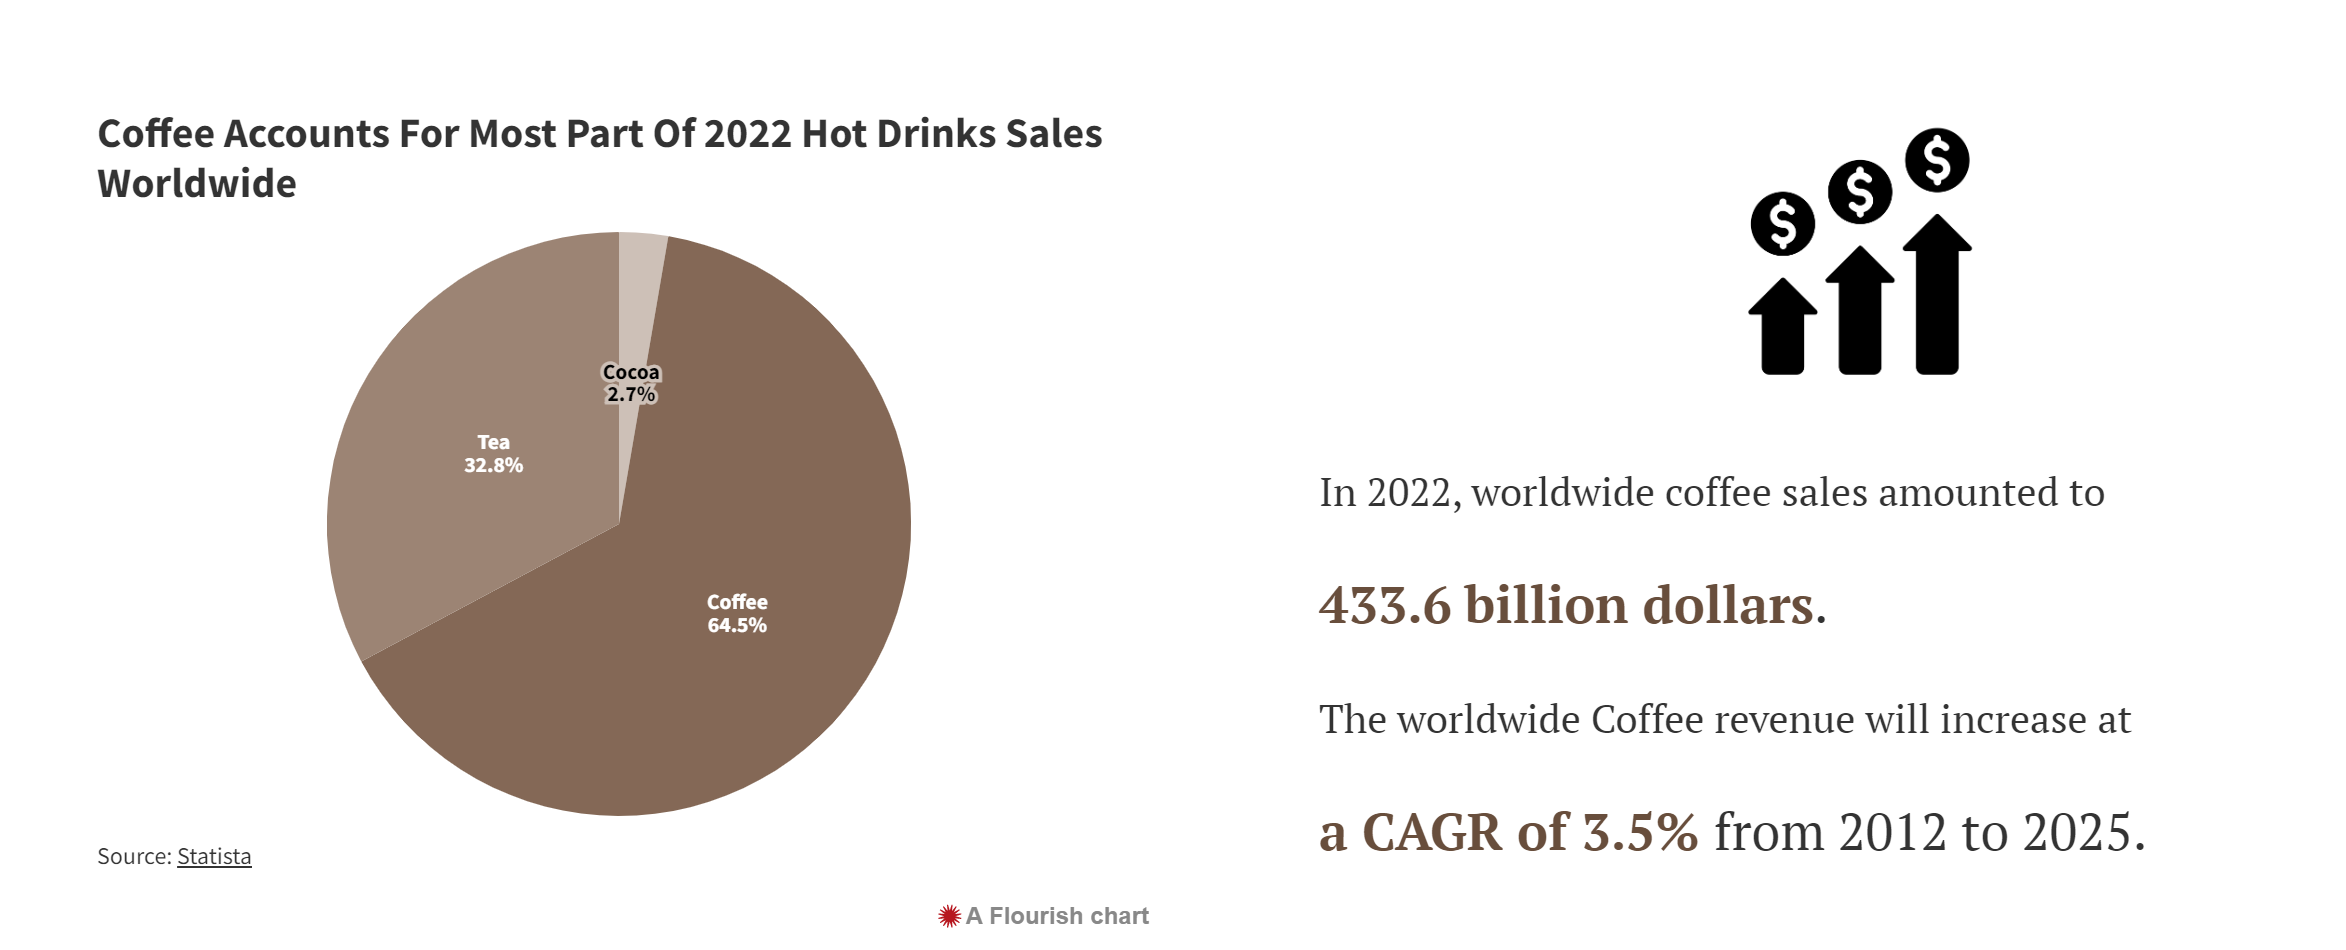
Given that I believe chart 1.2 is somewhat similar to the earlier consumption data and that I want to present the results with more understandable data, I changed the line chart of figure 1.2 into the form of text. In addition, I added the percentage unit for the pie chart.
After change:
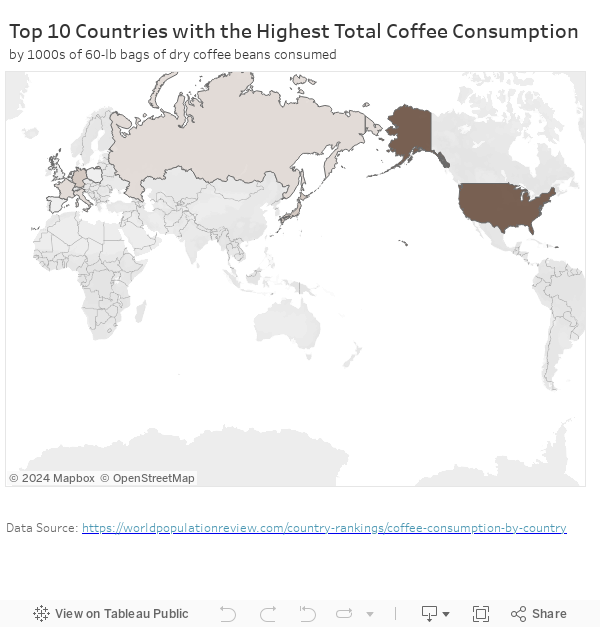
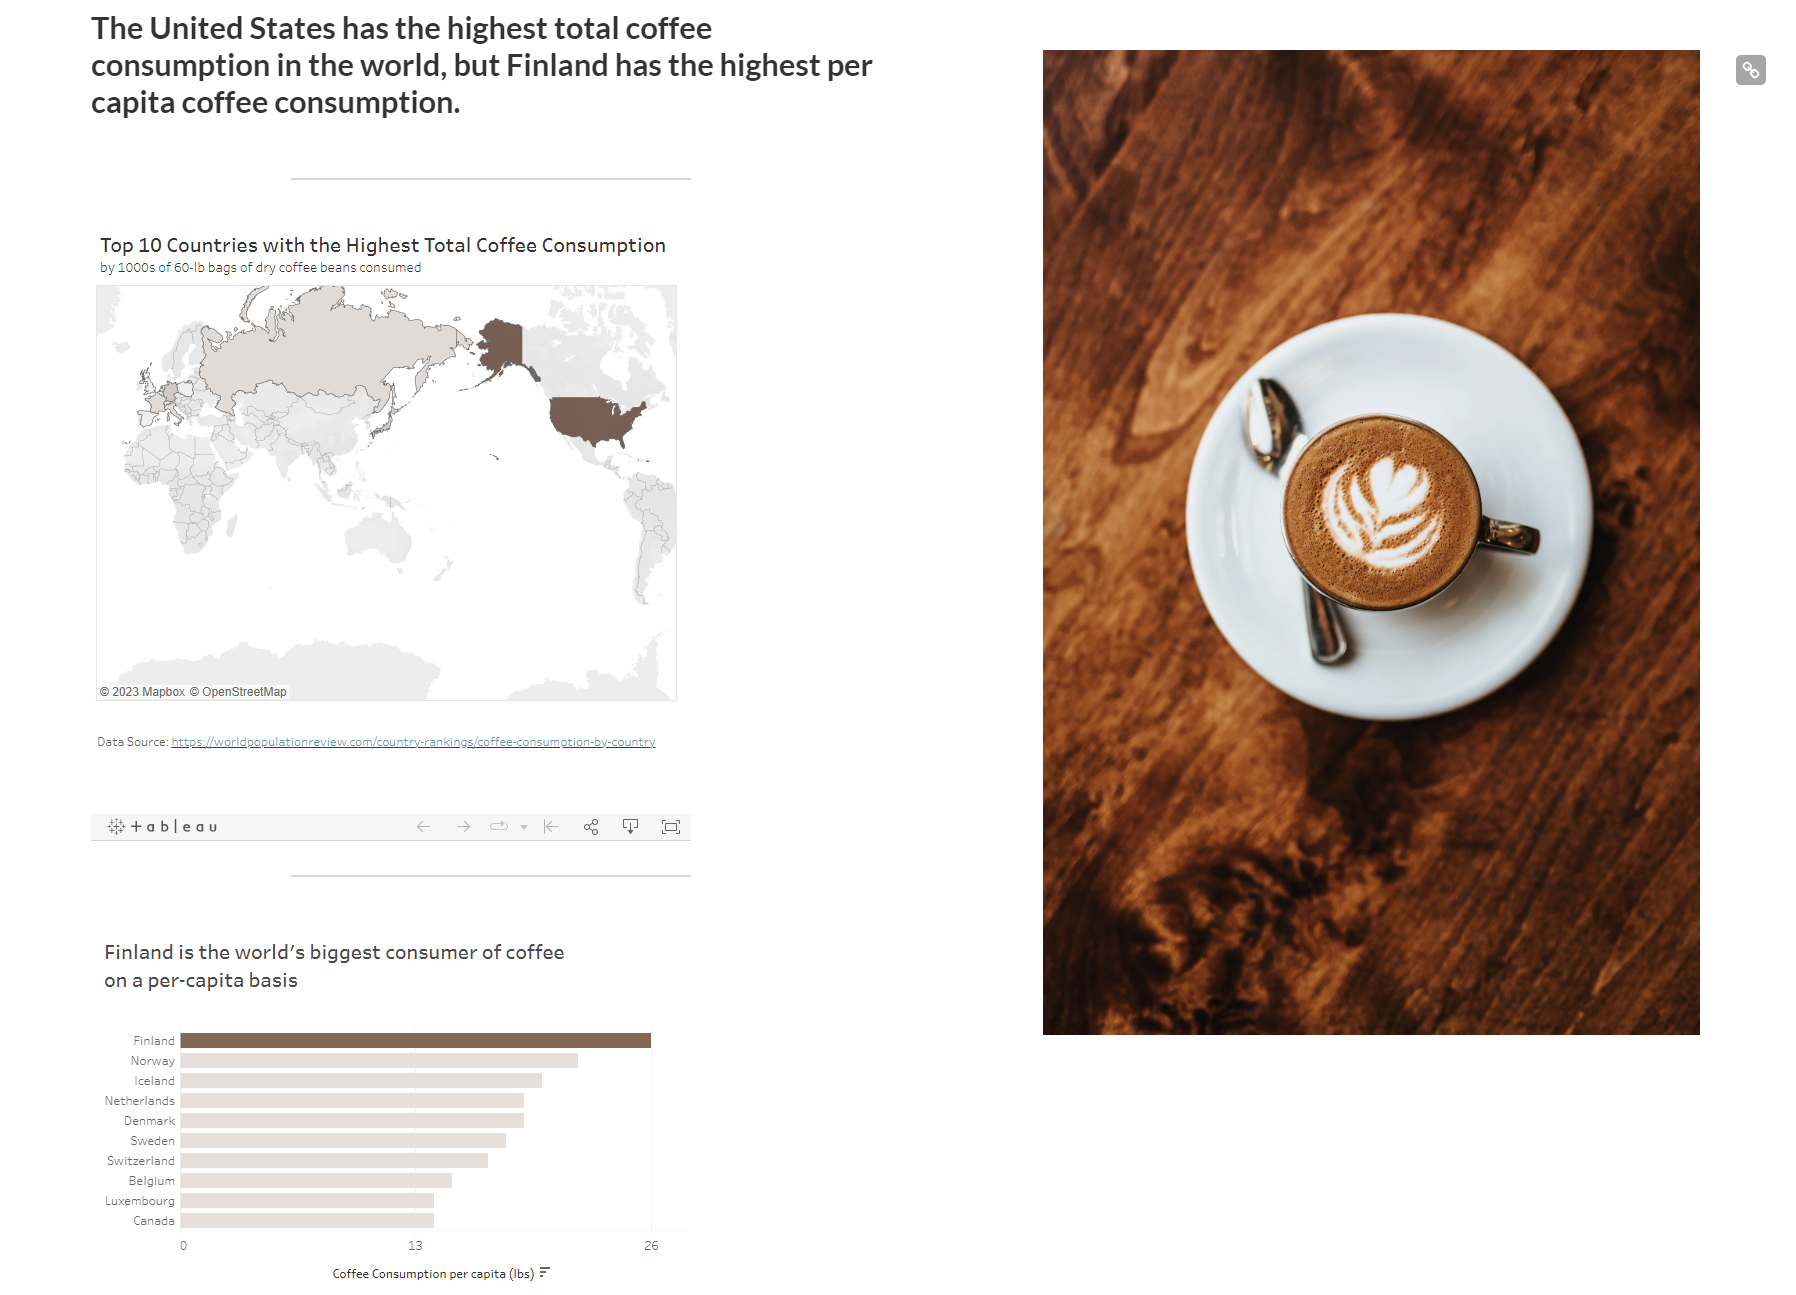
Part 1.3
In this part, I changed the title of the map chart to “Top 10 Countries with the Highest Total Coffee Consumption”. The title was changed to differentiate the meaning of the two visualizations. I present the two visualizations in order to better illustrate the differences in coffee consumption habits around the world.
The visualization after change:
Shorthand page after change:
Transition 1
From this transition, we will enter the first small turning point, but the story is still in the “setup” stage.

Part 2: Consumers’ initial perceptions on coffee
Order of presentation:
I changed the order of the previous part 2 and part 3. I will start off by discussing a misconception the general public has about coffee before presenting the opposite viewpoint in an effort to peak the audience’s interest.
Change for visualization:
I previously used a large number of icons to indicate the proportion, but according to user research, too many icons make it difficult to draw an obvious conclusion. So, first, I removed the filter and divided the original visualization into three parts: total, female, and male. I reduced the number of icons in the “total” visualization to four and changed the color of one icon to green and the rest to gray to better represent the “25%” ratio. Similarly, I reduced the female and male visualizations to ten icons.
After change:
After the change, there are three visualizations in total. I just insert these three visualizations on the Shorthand Page one by one.
Shorthand page after change:
Part 3: Caffeine content in beverages
For this visualization, I changed the title to “Caffeine Actually Exists in a variety of daily non-coffee beverages”. I added another category to compare the caffeine content. I added a transitional turning point between parts 2 and 3, which means the story will revert here and officially enter the “conflict” stage.
The visualization after change:
Shorthand page after change:
Part 4: A summary of the research on the relationship between coffee and health
For the visualization, I combined the two categories of “benefit” and “null effect,” as suggested by the user research respondent. This type of illustration makes it easier to understand that “according to the majority of research results, consumption of coffee will not harm the body.”
The visualization after change:
Shorthand page after change:
Transition 2
From this transition, we will enter the “solution” stage.
Part 5: Health benefits of drinking coffee
According to the user research, the respondent is confused about the meaning of the percentage. Therefore, for this visualization, I changed the title to “Moderate coffee may decrease the disease risk (by)”. The visualization is inserted into the Shorthand directly.
The visualization after change:
Transition 3
Before calling to action, I would like to raise the question to the audiences.
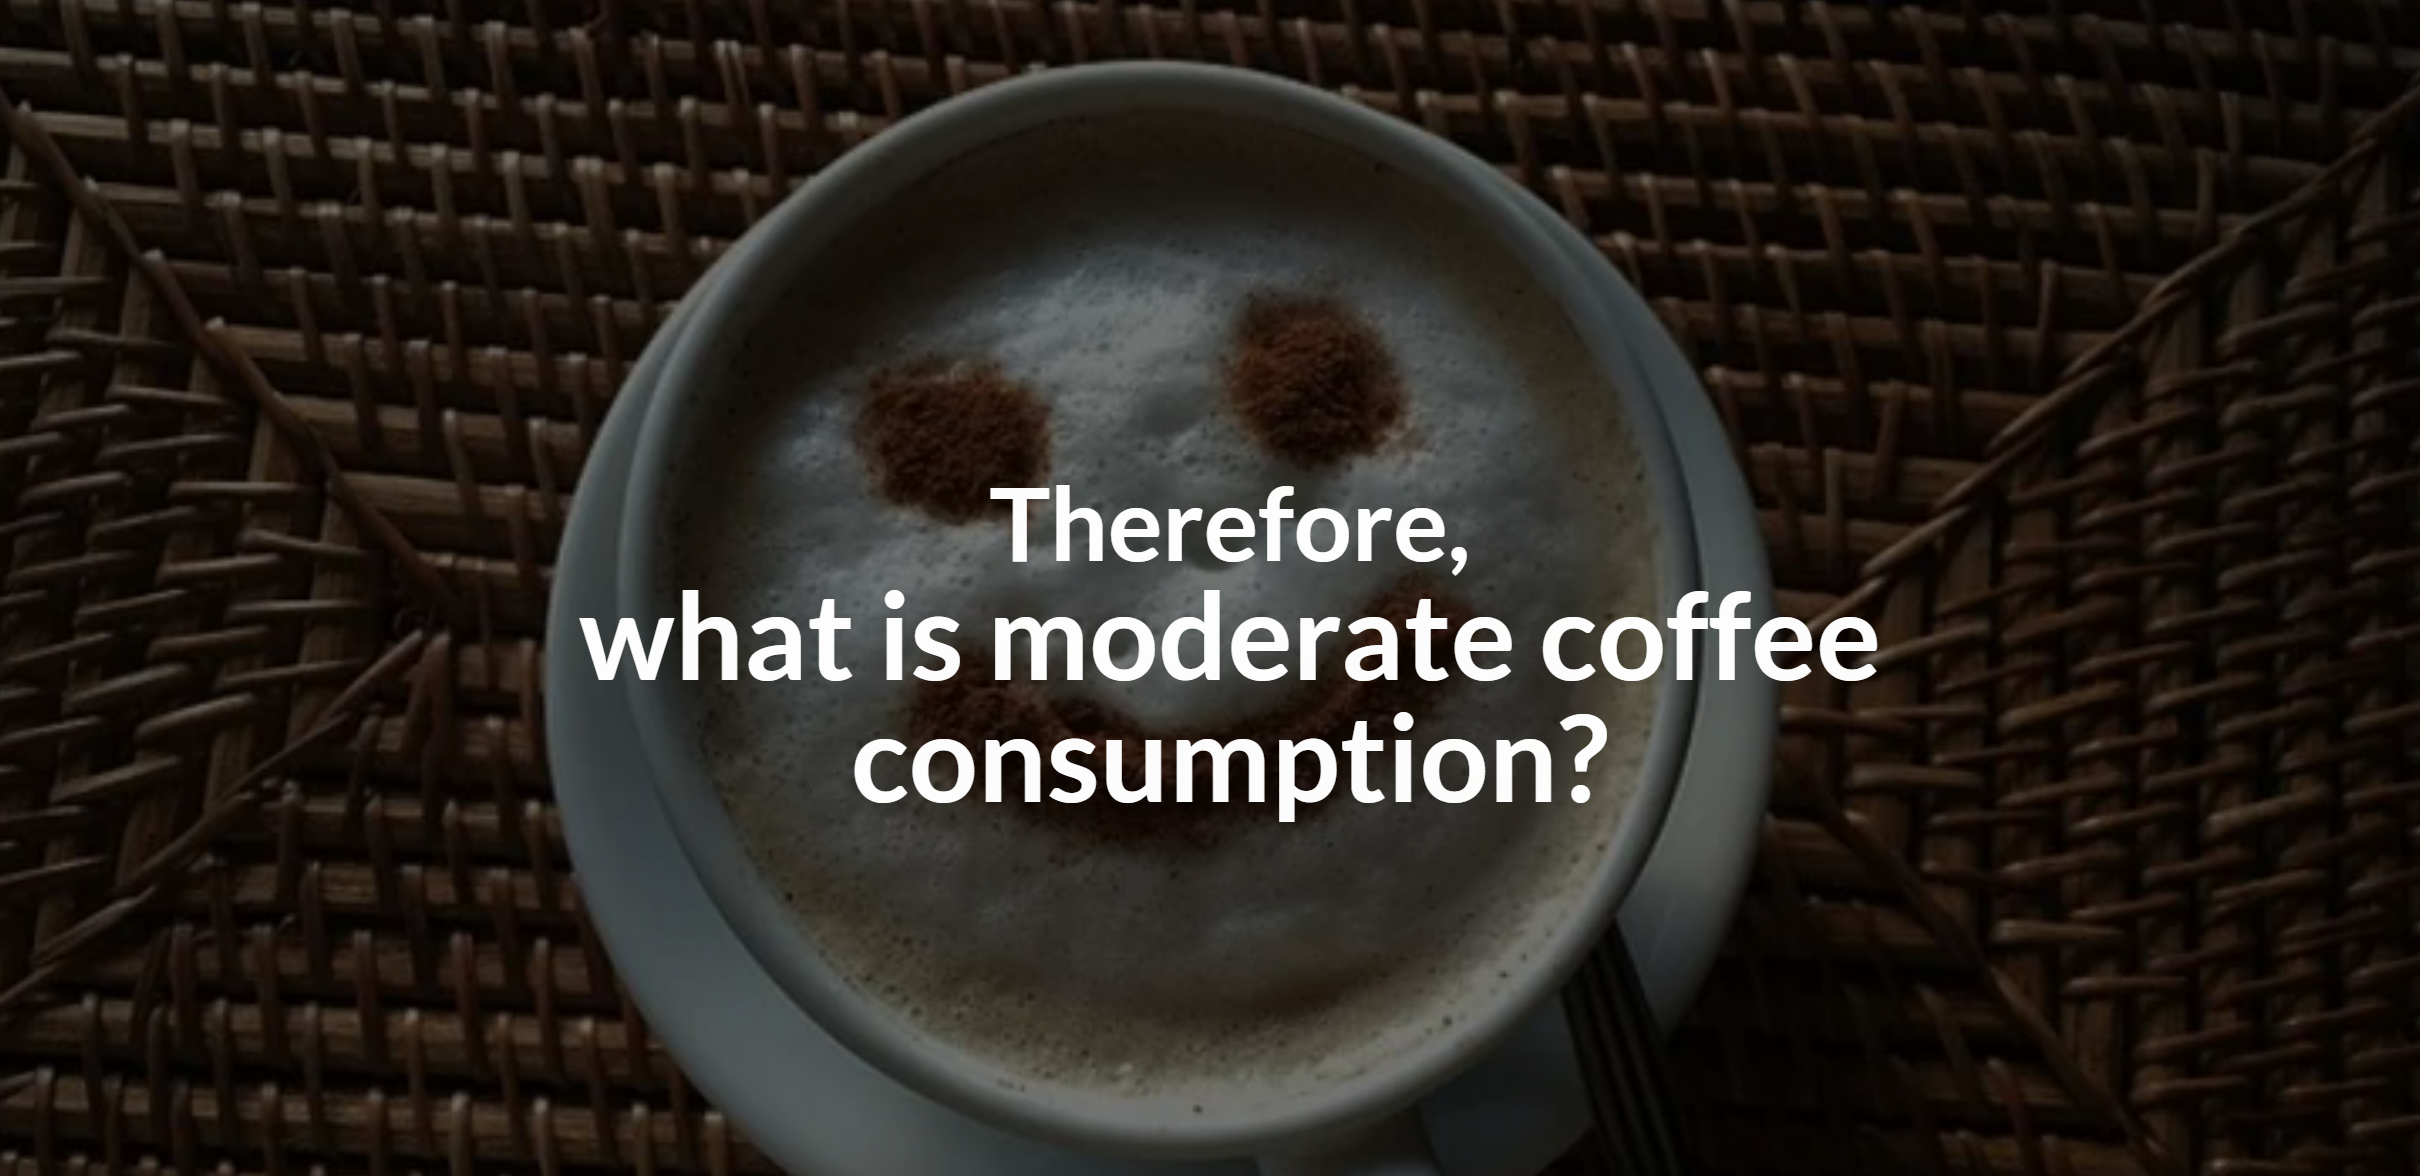
Part 6: Call to action - what is moderate consumption of coffee?
I changed the transparency of the last coffee cup to make the fifth one more transparent. In this way, the data of the moderate consumption of the title can be better explained. In addition, I changed the title “on average 400mg caffeine daily” to “Up to 400mg caffeine daily”. I included a warning about caffeine just below the visualization.
The visualization after change:
Shorthand page after change:

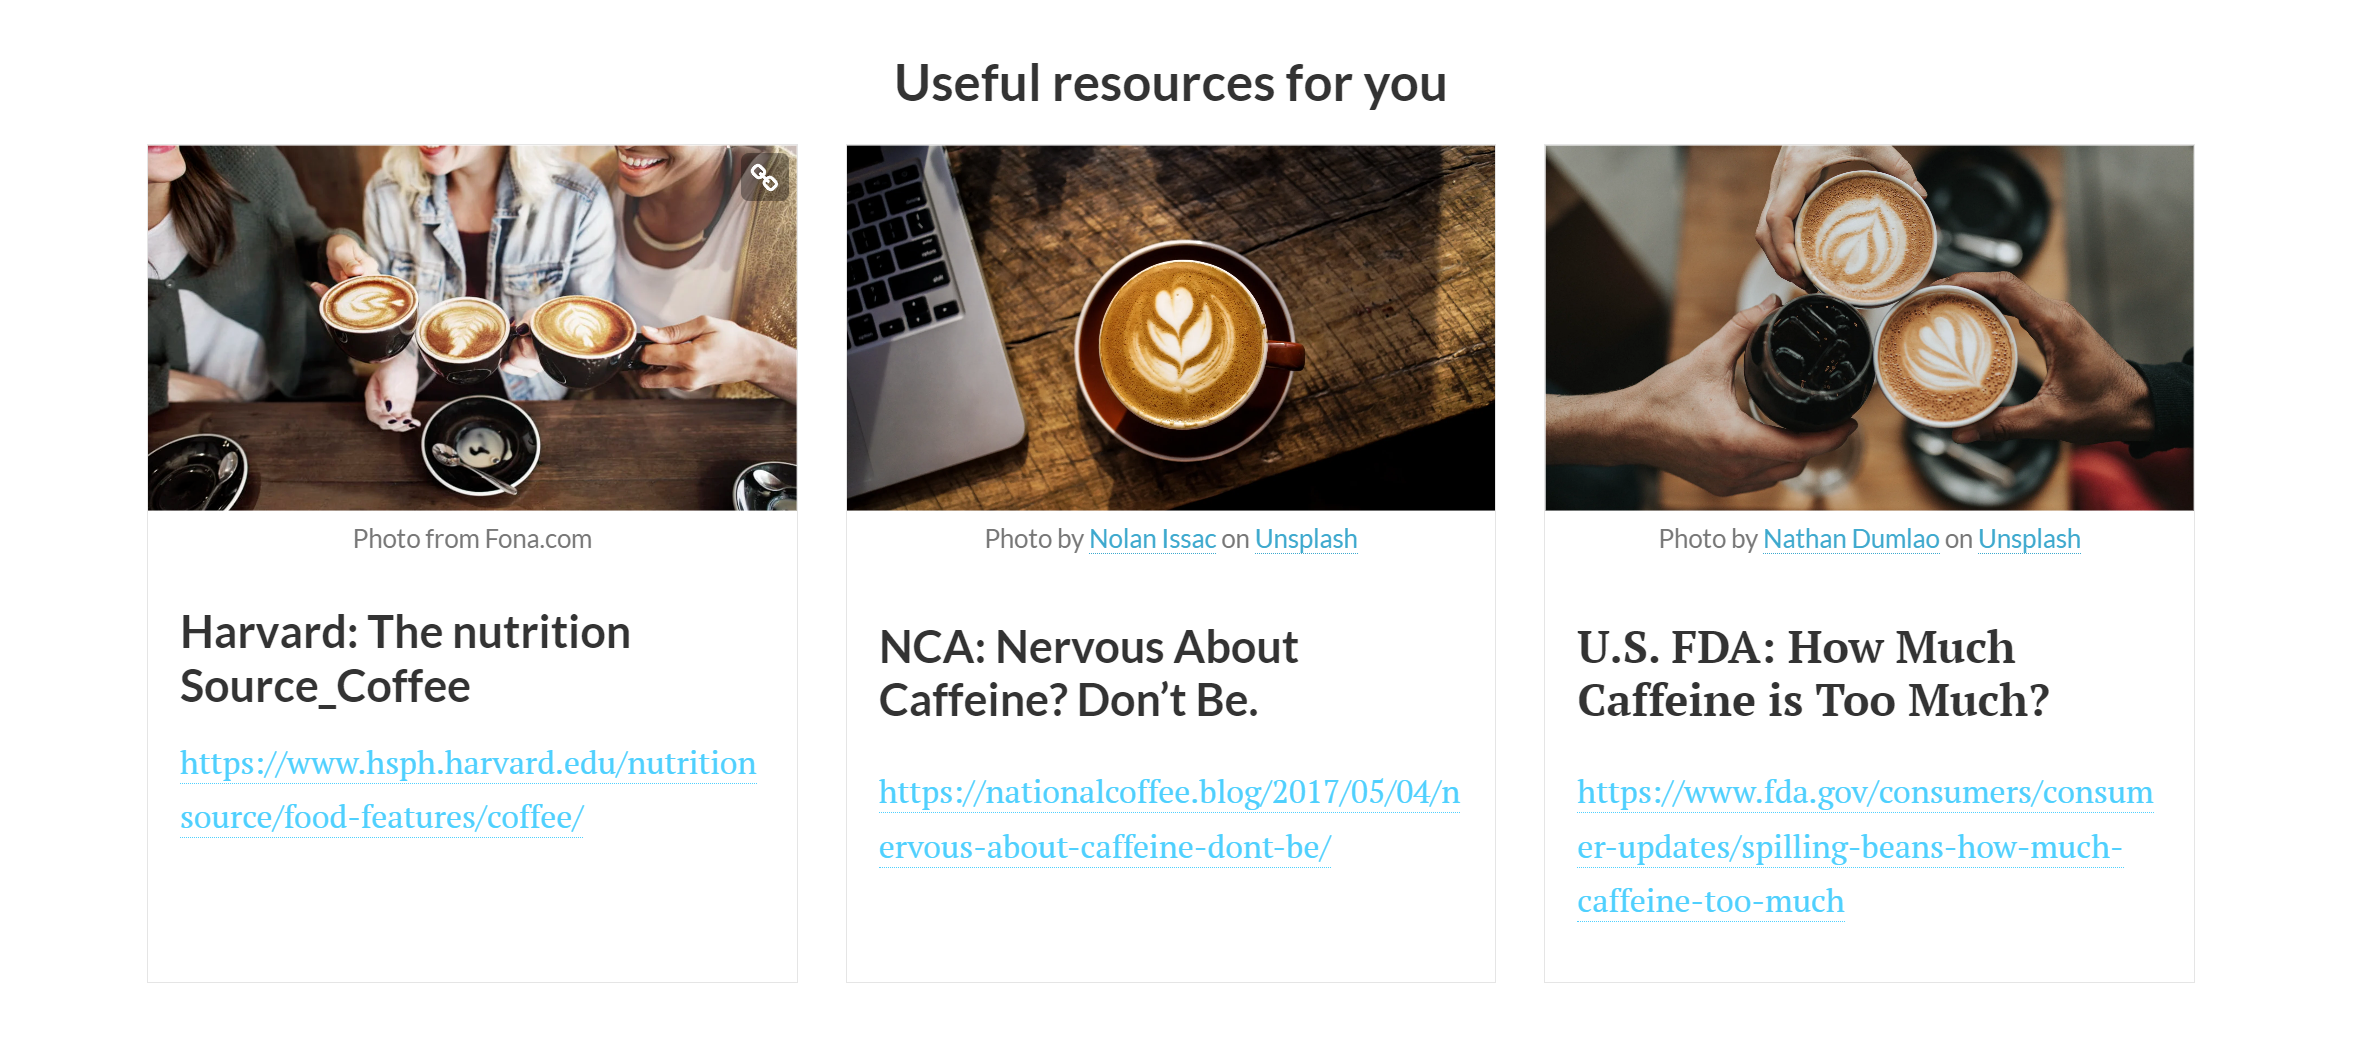
Resource for audiences
At the end, I included some links and articles that might be useful for the audience to continue research on coffee and health.
Final Thoughts
I think there are several key nodes in the process of completing this project:
- The first step is to determine the story’s logical structure. The emotion arc is an excellent way to define the story’s structure. You can improve the story’s appeal and ups and downs by judging the story’s climax. In addition to the emotional arc, “setup-conflict-solution” is a simple but effective story structure, and I used it in this project.
- Second, I believe the key point is to effectively use user research feedback. It is very useful, whether it is the feedback in the classroom or the suggestions of the three respondents. Because it is the first time they hear the story and see the storyboard, their first impressions and feedback are usually representative of the majority of audiences.
- When creating the final storyboard, I discovered that it differs from simply creating some visual charts. Because I need to ensure a story’s integrity, unity, readability, audience participation, and so on. To attract audiences, it is necessary to have a good understanding of the rhythm of the storyboard, not to have too many visualizations connected together, and not to have too much textual information, but also to have some ingenuity.
References
list of data
| Name and URL | Desceiption |
|---|---|
| Statista: Coffee consumption worldwide from 2012/13 to 2020/21 | The specific data will be used to re-visualize and calculate the global coffee consumption growth rate. |
| World Coffee Consumption Statistics | Data from the report and analysis of world coffee consumption trends will be used for report. |
| Motives And Preferences For Coffee Consumption | Data from ICO will be used for report. |
| Coffee consumption hits two-decade high - Spring 2022 National Coffee Data Trends report | Analysis and idea of USA coffee consumption will be used for report. |
| Statista: Hot Drinks Consumer Markets Insights | Data of hot drinks revenues and volumes will be used for visualization. |
| Coffee Consumption by Country 2023 | Data on the top 10 countries that drink the most coffee will be used for visualization. |
| Caffeine Content of Beverages Data | The dataset will be used to make the visualization。 |
| Consumers’ Perceptions of Coffee Health Benefits and Motives for Coffee Consumption and Purchasing | A summary of consumer perception in the literature and survey data will be used. |
| A Comprehensive Overview of the Risks and Benefits of Coffee Consumption | The overall data in the table of studies on the relationship between coffee and disease in the literature will be used. |
| Harvard: The nutrition Source_Coffee | The data and ideas about the benefit of coffee will be cited. |
| Nervous About Caffeine? Don’t Be. | Provide inspiration for my topic, and data on caffeine intake will be used. |
| The Impact of Coffee on Health | The data in the research will be used. |
| How Much Caffeine is Too Much? | The data for moderate coffee consumption will be used. |
| Coffee Photos | The pictures of coffee will be used. |
| Coffee Photos | The pictures of coffee will be used. |
| Coffee Photos | The pictures of coffee will be used. |
| Coffee Photos | The pictures of coffee will be used. |