Yu-portfolio
RawGraph Exercise
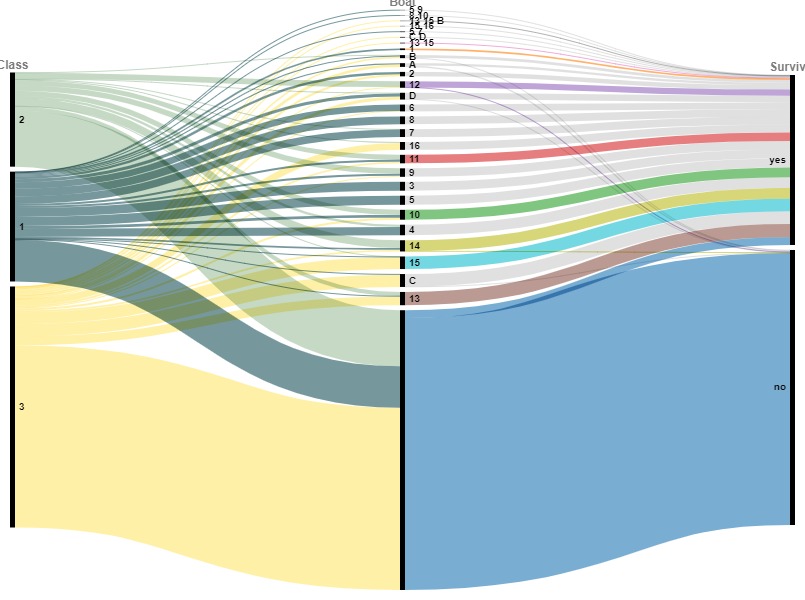
In this exercise, I used the Alluvial Diagram in RawGraph to provide insight into who survived the Titanic disaster and who didn’t.
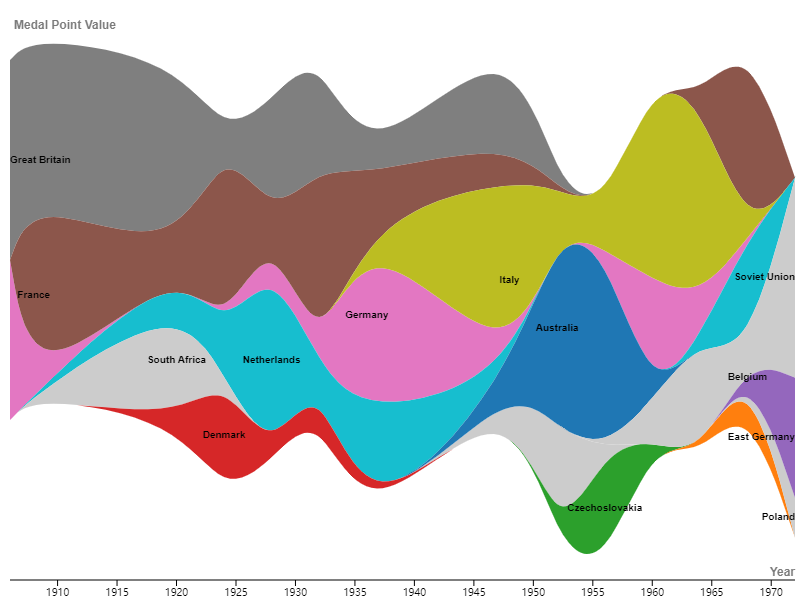
For the following visualization, I used Streamgraph to analyze Tandem Bicycle Medalists by country.
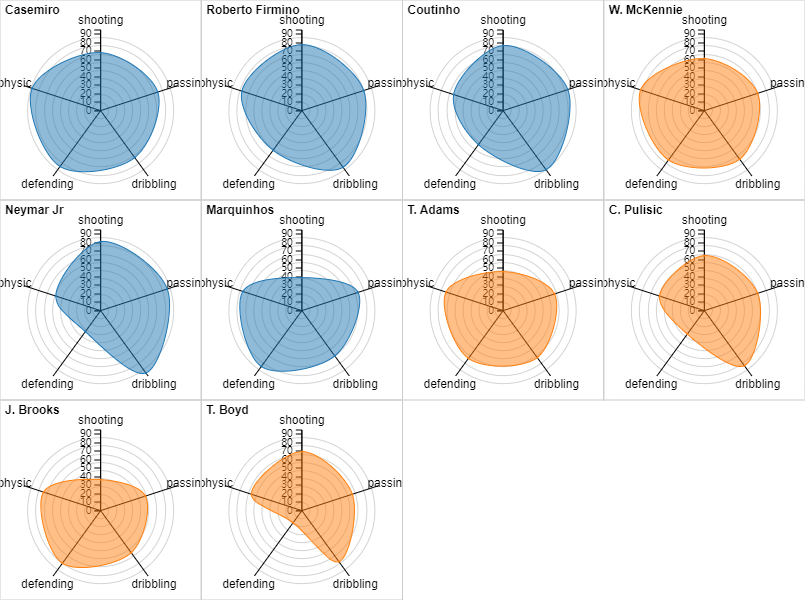
For the next visualization, I used Radar Chart to show the FIFA Player power rankings.